OPERATIONS MANAGEMENT
ERROR ESTIMATES IN FORECASTING
Error estimates in forecasting is very important. Demand forecast influences most of the decisions in all the functions. Hence, it must be estimated with the highest level of precision. Some common measures are inevitable to measure the accuracy of a forecasting technique. The measure may be an aggregate error of the forecast values from the actual demands. The different types of errors which are generally computed are:
- Mean Absolute Deviation (MAD)
- Mean Square Error (MSE)
- Mean Forecast Error (MFE)
- Mean Absolute Percentage Error (MAPE)
-
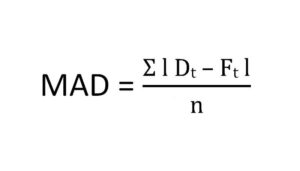
Mean Absolute Deviation (MAD):
It is the mean of absolute deviations of forecast demands from actual demand values. The MAD is sometimes called as the mean absolute error (MAE).

where,
Dt = Actual demand for the period t
Ft = Forecast demand for the period t
n = Number of time period used
It gives the absolute magnitude of error for a certain period of time without taking sign of error into consideration.
-
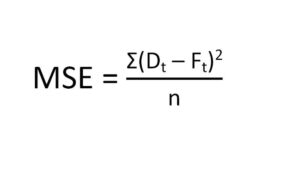
Mean Square Error (MSE):
Mean square error is the mean of the squares of the deviations of the forecast demands from the actual demand values. Usually the effects on operations of small errors are not serious. These errors may not be smoothed out by inventory overtime work. It will be difficult to have smoothed values for forecast if there are few large errors. Consequently, a method of measuring errors that penalizes large errors more than small errors is some time desired. The mean square error (MSE) provides this type of measure of forecast error.

where,
Dt = Actual demand for the period t
Ft = Forecast demand for the period t
n = Number of time period used
It calculates the forecast error with regard to direction and shows any tendency of over and under estimated forecasting.
Positive Bias indicates under estimated forecasting.
Negative Bias indicates over estimated forecasting.
-
Mean Forecast Error (MFE):
Mean forecast error (MFE) is the mean of the derivations of the forecast demands from the actual demands.

where,
Dt = Actual demand for the period t
Ft = Forecast demand for the period t
n = Number of time period used
It is used to compute standard deviation for forecast error which is utilized to plot the control chart for forecast error.
-
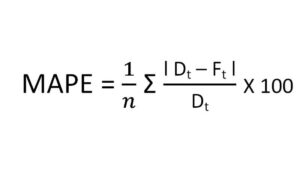
Mean Absolute Percentage Error:
Mean absolute percentage error (MAPE) is the mean of the percent deviations of the forecast demands from the actual demands.

where,
Dt = Actual demand for the period t
Ft = Forecast demand for the period t
n = Number of time period used
It is the average of percentage error compared to actual demand.
RELATED VIDEOS FOR ERROR ESTIMATES IN FORECASTING:
